The best NBA players of all time, by the numbers
Not a panel, not a vote, and not my opinion. These are the 37 players the game's own rating system puts at 95 or above — every one of them scored against the league he actually played in, weighted by what his position is asked to do, with championships and awards counted.
Start an auctionThe method is written up in full on how the ratings work, including every weight and the things it deliberately does not measure. Nothing on this page was adjusted to make the list look sensible.
Why there is no number one to fifty
Because the ratings do not support one. Twenty players share a 94. Fourteen share a 95. A ranked list of fifty would have to order those groups by something, and that something would not be basketball — it would be alphabetical order wearing a number.
So the list stops at a rating boundary rather than a round number, and players inside a band are genuinely tied. Within each band they are listed alphabetically, which is honest about being arbitrary rather than dressed up as a ranking.
Rated 99 · 2 players, tied
| Photograph | Player | Pos | Career | PPG | RPG | APG |
|---|---|---|---|---|---|---|
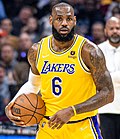 |
LeBron James | SF | 2004-2026 | 29.4 | 7.6 | 7.7 |
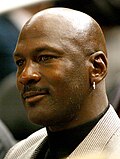 |
Michael Jordan | SG | 1985-2003 | 33.7 | 6.8 | 6.7 |
Rated 98 · 6 players, tied
| Photograph | Player | Pos | Career | PPG | RPG | APG |
|---|---|---|---|---|---|---|
 |
Julius Erving | SF | 1972-1987 | 28.2 | 10.9 | 5.2 |
 |
Kareem Abdul-Jabbar | C | 1970-1989 | 26.7 | 14.6 | 4.4 |
 |
Kobe Bryant | SG | 1997-2016 | 31.8 | 5.8 | 5.1 |
 |
Larry Bird | SF | 1980-1992 | 27.5 | 9.8 | 7.0 |
 |
Magic Johnson | PG | 1980-1996 | 21.4 | 7.2 | 12.3 |
 |
Tim Duncan | PF | 1998-2016 | 23.8 | 12.7 | 3.6 |
Rated 97 · 7 players, tied
| Photograph | Player | Pos | Career | PPG | RPG | APG |
|---|---|---|---|---|---|---|
 |
David Robinson | C | 1990-2003 | 27.5 | 11.2 | 3.6 |
 |
Giannis Antetokounmpo | PF | 2014-2026 | 28.4 | 12.4 | 5.8 |
 |
Jerry West | SG | 1961-1974 | 28.2 | 4.8 | 6.9 |
 |
Karl Malone | PF | 1986-2004 | 26.4 | 9.9 | 4.2 |
 |
Kevin Durant | SF | 2008-2026 | 29.5 | 7.5 | 4.9 |
 |
Kevin Garnett | PF | 1996-2016 | 23.1 | 13.6 | 5.6 |
 |
Shaquille O'Neal | C | 1993-2011 | 28.6 | 12.5 | 3.5 |
Rated 96 · 8 players, tied
| Photograph | Player | Pos | Career | PPG | RPG | APG |
|---|---|---|---|---|---|---|
 |
Chris Paul | PG | 2006-2026 | 21.2 | 4.6 | 11.2 |
 |
Dwyane Wade | SG | 2004-2019 | 27.5 | 5.4 | 6.2 |
 |
Hakeem Olajuwon | C | 1985-2002 | 27.0 | 11.9 | 3.5 |
 |
James Harden | SG | 2010-2026 | 33.7 | 6.2 | 7.9 |
 |
Nikola Jokić | C | 2016-2026 | 26.0 | 12.7 | 8.9 |
 |
Oscar Robertson | PG | 1961-1974 | 30.7 | 7.6 | 11.1 |
 |
Stephen Curry | PG | 2010-2026 | 26.0 | 4.7 | 7.6 |
 |
Wilt Chamberlain | C | 1960-1973 | 44.1 | 24.1 | 3.6 |
Rated 95 · 14 players, tied
| Photograph | Player | Pos | Career | PPG | RPG | APG |
|---|---|---|---|---|---|---|
 |
Bill Russell | C | 1957-1969 | 17.2 | 23.3 | 3.3 |
 |
Bob Cousy | PG | 1951-1970 | 20.2 | 6.1 | 7.2 |
 |
Bob Pettit | PF | 1955-1965 | 27.7 | 17.9 | 3.4 |
 |
Charles Barkley | SF | 1985-2000 | 26.1 | 11.5 | 4.1 |
 |
Dirk Nowitzki | PF | 1999-2019 | 25.8 | 9.2 | 3.1 |
 |
Dwight Howard | C | 2005-2022 | 20.6 | 13.7 | 1.5 |
 |
Elgin Baylor | SF | 1959-1972 | 35.4 | 17.4 | 4.9 |
 |
Gary Payton | PG | 1991-2007 | 21.8 | 5.4 | 8.6 |
 |
Joel Embiid | C | 2017-2026 | 32.5 | 11.0 | 4.5 |
 |
John Havlicek | SF | 1963-1978 | 26.9 | 8.3 | 7.3 |
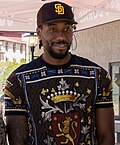 |
Kawhi Leonard | SF | 2012-2026 | 24.3 | 6.6 | 3.1 |
 |
Rick Barry | SF | 1966-1980 | 33.0 | 8.6 | 3.6 |
 |
Russell Westbrook | PG | 2009-2026 | 27.7 | 8.7 | 9.9 |
 |
Scottie Pippen | SF | 1988-2004 | 20.9 | 7.7 | 5.6 |
Photograph credits
Every portrait comes from Wikimedia Commons under the licence named beside it.
- LeBron James — Erik Drost, CC BY 2.0
- Michael Jordan — Joshua Massel. Cropped by en:User:Quadzilla99, CC BY-SA 2.0
- Julius Erving — Ash Carter, CC BY 2.0
- Kareem Abdul-Jabbar — Yahoo from Sunnyvale, California, USA, CC BY 2.0
- Kobe Bryant — Keith Allison, CC BY-SA 2.0
- Larry Bird — Kurt Shimala, CC BY-SA 2.0
- Magic Johnson — Daniel Benavides from Austin, TX, CC BY 2.0
- Tim Duncan — Geoff Livingston, CC BY 2.0
- David Robinson — Mark Neyman, CC BY-SA 3.0
- Giannis Antetokounmpo — Erik Drost, CC BY 2.0
- Jerry West — Malcolm W. Emmons, Public domain
- Karl Malone — Airman 1st Class Jacob B. Wrightsman, Public domain
- Kevin Durant — Clément Bardot, CC BY-SA 4.0
- Kevin Garnett — Keith Allison from Baltimore, USA, CC BY-SA 2.0
- Shaquille O'Neal — TechCrunch, CC BY 2.0
- Chris Paul — Erik Drost, CC BY 2.0
- Dwyane Wade — Flickr user Keith Allison, CC BY-SA 2.0
- Hakeem Olajuwon — U.S. Department of State, Public domain
- James Harden — Erik Drost, CC BY 2.0
- Nikola Jokić — All-Pro Reels, CC BY-SA 2.0
- Oscar Robertson — Governor Eric Holcomb, Public domain
- Stephen Curry — Clément Bardot, CC BY-SA 4.0
- Wilt Chamberlain — Bill Allen, Public domain
- Bill Russell — Unknown authorUnknown author, Public domain
- Bob Cousy — Unknown authorUnknown author, Public domain
- Bob Pettit — Unknown authorUnknown author, Public domain
- Charles Barkley — Wright-Patt AFB, Public domain
- Dirk Nowitzki — Keith Allison from Baltimore, USA, CC BY-SA 2.0
- Dwight Howard — Erik Drost, CC BY 2.0
- Elgin Baylor — Unknown authorUnknown author, Public domain
- Gary Payton — Keith Allison, CC BY-SA 2.0
- Joel Embiid — All-Pro Reels, CC BY-SA 2.0
- John Havlicek — Unknown authorUnknown author, Public domain
- Kawhi Leonard — U.S. Marine Corps photo by Lance Cpl. Mhecaela J. Watts, Public domain
- Rick Barry — Corey Carter from Fremont, US, CC BY 2.0
- Russell Westbrook — Erik Drost, CC BY 2.0
- Scottie Pippen — Sea Cow, CC BY-SA 4.0
The placings that will start arguments
Every rating system produces results its author would not have chosen. Here are this one's, and why they happen — including the one I think is a genuine flaw rather than a defensible surprise.
Julius Erving, third all time
Higher than almost any consensus list puts him, and this is the weakest result on the page. Every player is scored against the league he played in, and Erving's peak years were in the ABA — a genuinely weaker league. Being three standard deviations above the ABA is not the same achievement as being three above the NBA, and the system cannot tell the difference, because within-season normalisation has no way to compare the strength of two leagues running at once.
It is the honest cost of the era-neutral approach. The alternative — a hand-tuned discount on ABA seasons — would be an opinion inserted into a method whose whole claim is that it does not contain any.
Wilt Chamberlain outside the top ten
With a peak of 44.1 points and 24.1 rebounds a game, which sounds absurd until you remember two things the system knows. His league ran about 126 possessions a game to today's 99, so those totals are scored against team-mates and opponents who were also collecting far more of everything. And every attribute is judged against other centres, where dominant rebounding was the norm rather than the exception.
He is still rated 96, which is the top one per cent of everyone who has played. The gap between him and the top is accolades: two championships to Russell's eleven.
Bill Russell, on 17.2 points a game
The clearest case of the accolade weighting doing its job. Russell's box score is ordinary by the standards of this list, and blocks — the thing he was best at in the history of the sport — were not recorded during his career. Without championships counted he would rank nowhere at all. With them he sits at 95.
Dwight Howard in the top forty
Three Defensive Player of the Year awards, elite rebounding and rim protection, and a position whose weighting rewards exactly those things. The system is measuring what it says it measures. Whether he belongs in this company is a question about whether the weights are right, which is a fair argument and the reason they are all published.
Bob Cousy and Elgin Baylor
Both lifted by era-relative scoring. Cousy's assist numbers were extraordinary against 1950s league averages even though they look modest now; Baylor's 35.4-point peak came in a league where that still led everyone. This is the normalisation working as designed — the same mechanism that stops modern players automatically dominating a list on raw totals.
What this list is not
- It is not adjusted for how it looks. No player was moved. If a placing seems wrong, the argument is with a weight, and every weight is published.
- It does not use playoff box scores. Player-level postseason data only exists from 1996 in this dataset, so using it would quietly favour anyone peaking after that. Team run depth is used instead, which covers every era.
- It is not the order you bid in. In the game these players sit in a pool with everybody else, and a 95 you buy for eight million is a better piece of business than a 98 you pay sixty for.
The quickest way to disagree with any of this is to go and build a five out of them.
Play the all-time auctionHow the ratings work How players are priced How to play FAQ About Contact Privacy